Truckload Capacity Trends
What’s affecting truckload capacity?
As mentioned in my previous update, the capacity crunch industry experts have been discussing for several years appears to be here. But how do we know this isn’t an issue that eventually will normalize? And why is this time different from other supply chain disruptions?
To better understand what’s going on, we can look at national measures of freight volume and capacity, and see how today’s market compares to previous events.
Indicators that freight volumes are rising
Individual businesses have their own processes for determining when shipment volume is above average (based on individual lane trends, equipment availability, etc.), but other factors are used industry-wide to gauge overall market activity. Two common indicators are the load-to-truck ratio and the Cass Freight Index™. These generally serve as reliable signals of changes across the board.
Load-to-truck ratio
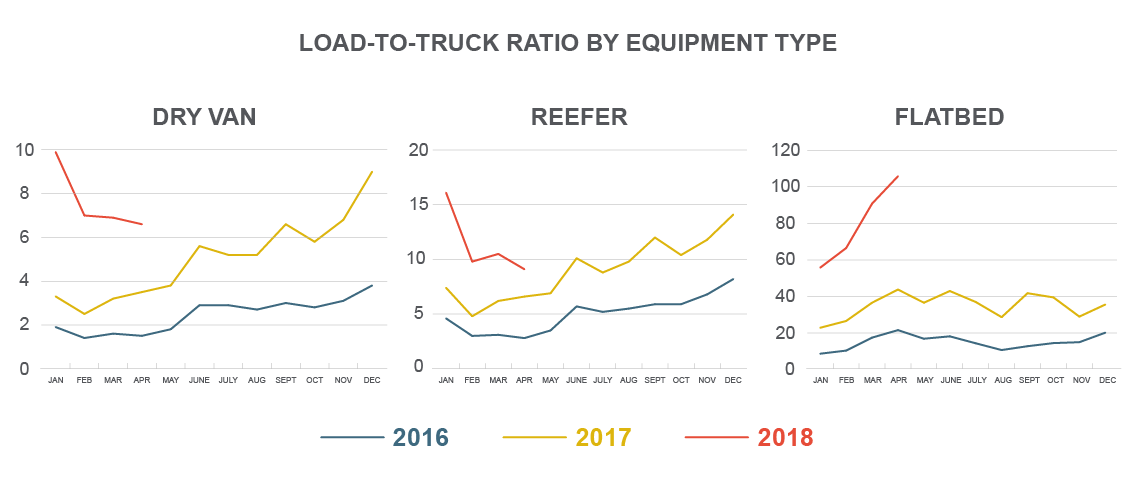
One of the biggest indicators of tight capacity is the load-to-truck ratio. Evaluated nationally by DAT Solutions®, this number represents how many loads are available for every posted truck/trailer. The higher the number, the tighter the capacity, and (most often) the greater the likelihood that rates will increase for spot market freight.
The load-to-truck ratio is a trusted way of looking at the market, but it’s good to keep in mind that it doesn’t always provide a complete measure of capacity. This is because the national averages are found through online transactions and don’t account for carriers that actively find freight over the phone.
The charts below show how the load-to-truck ratio has fluctuated for different equipment types since 2016:
Cass Freight Index™
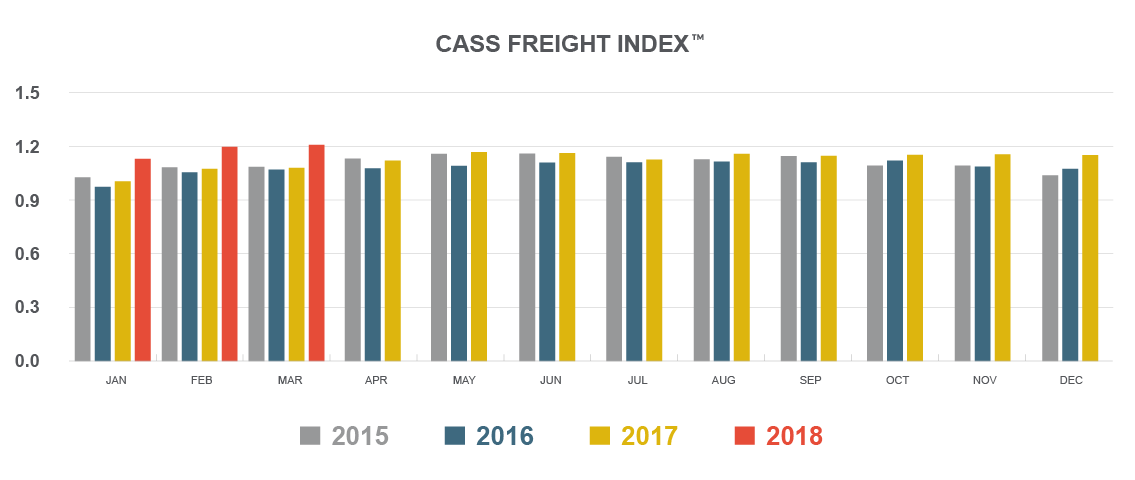
The Cass Freight Index™ uses transactions processed by Cass Information Systems, Inc.® to measure freight volumes in North America. It uses a baseline of 1.0 (representing shipment volume in January 1990). While shipments could have taken place outside of the month the transaction occurred, this index still provides a good look at total volume across all transportation modes. It’s often used with the load-to-truck ratio to predict capacity issues and rate changes.
Previous capacity shakeups
Everything from natural disasters to significant changes in the industry can cause capacity fluctuations. The severity and longevity of the change depends on the nature of the event and how the economy and industry respond to it. While some things will cause temporary havoc for a particular region, it often takes a very large event to affect capacity across the nation.
For example, in 2005, Hurricane Katrina resulted in more than $100 billion in damage and affected transportation nationwide due to the devastation to ports, roads, rail lines and airports. But not all weather events create the same impact.
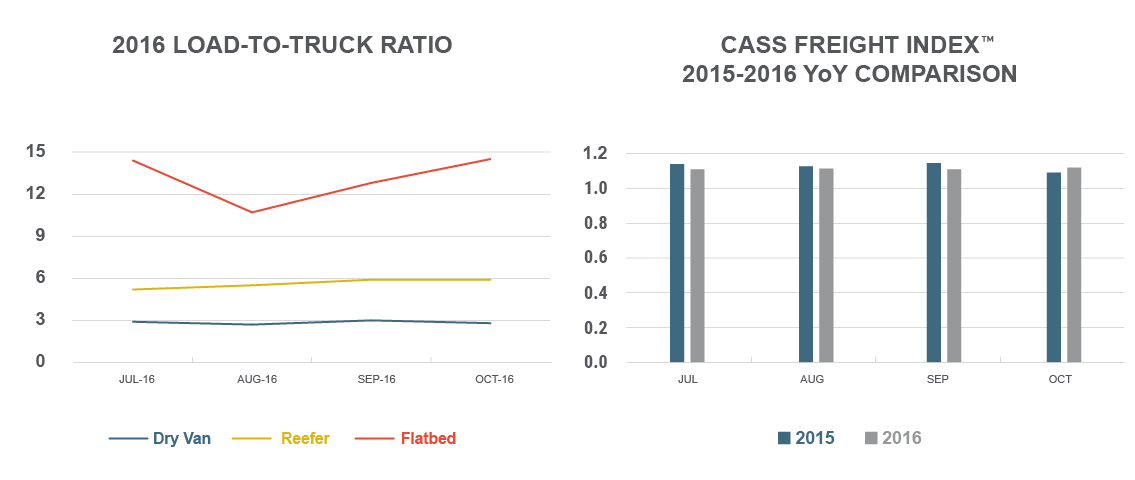
The Louisiana flooding in August 2016 is a good example of this. According to the Louisiana Economic Development agency, the flooding affected nearly 20 percent of the state’s businesses, and regional shipping practices were impacted as well. According to DAT Solutions®, several lanes saw a drastic increase in rates post-flooding, but there wasn’t much of a capacity change on a national scale:
July 2016: Van load to truck ratio was 2.9; reefer 5.2; flatbed 14.4
August 2016: Van load to truck ratio was 2.7; reefer 5.5; flatbed 10.7
September 2016: Van load to truck ratio was 3; reefer 5.9; flatbed 12.8
October 2016: Van load to truck ratio was 2.8; reefer 5.9; flatbed 14.5
Source: DAT Solutions®
The Cass Freight Index™ also didn’t reflect much of a change, with shipment volumes actually smaller than in previous years:
Even coinciding with Hanjin Shipping Co. filing for bankruptcy and causing increased rates for outbound shipments on the West Coast, this event didn’t create the same type of situation we’re experiencing now.
Current conditions
The current capacity crunch is a combination of multiple elements. Hurricanes Harvey and Irma, ELD enforcement and an increasing driver shortage are just some of the causes of today’s shipping environment. Even looking at only the last two quarters, it’s clear that national capacity is still affected:
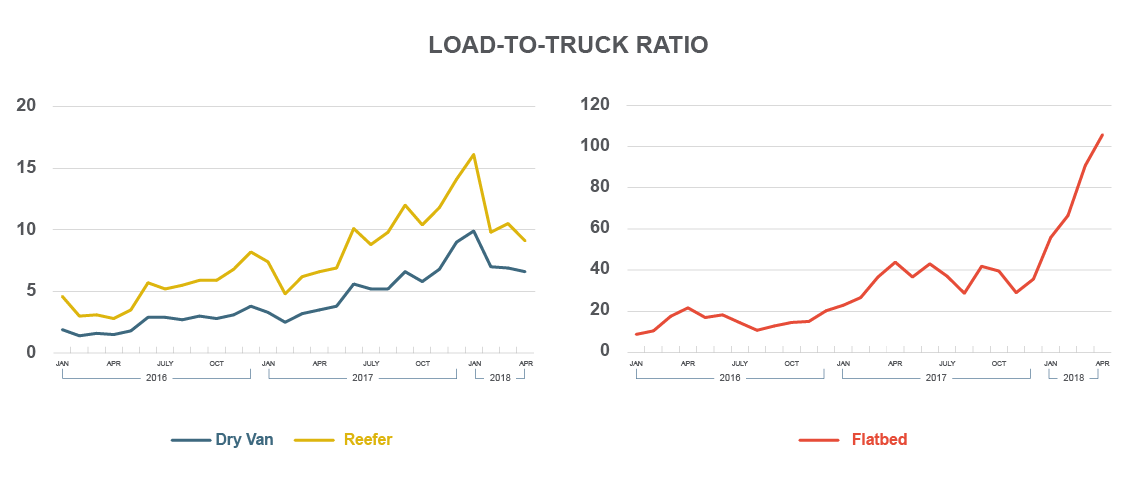
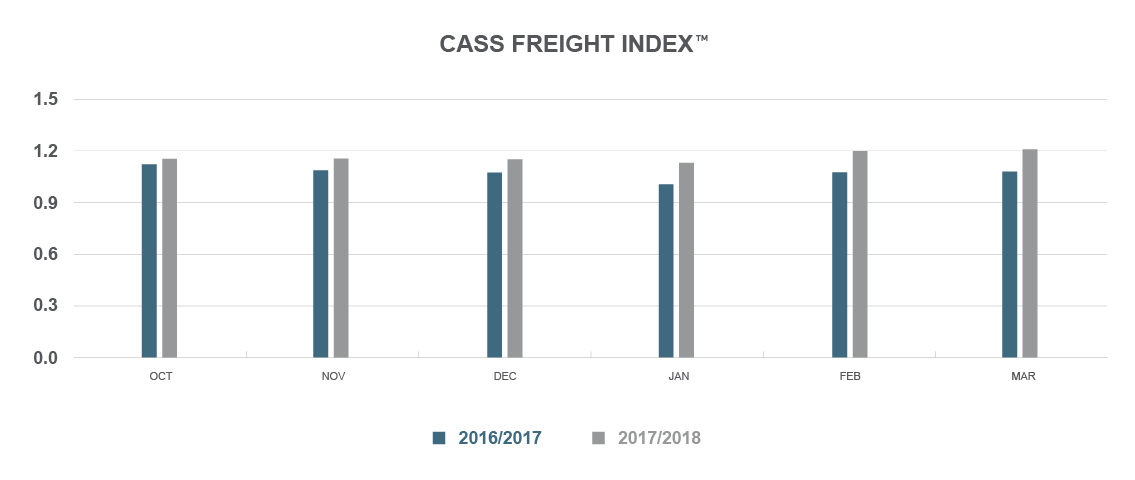
Numbers like these clearly indicate some turmoil in the industry, but why is this continuing for so long?
Unlike weather events that eventually normalize or one-time industry updates, the ELD mandate and driver shortage are causing a long-term change to how drivers and carriers operate. A new type of shipping environment might well be upon us, making it more important than ever to find capacity solutions.
ArcBest is a logistics company with owned assets, giving us the unique ability to meet customer needs during periods of limited equipment availability. To learn more about our assured capacity solutions, call 800-610-5544.

